

| 일 | 월 | 화 | 수 | 목 | 금 | 토 |
|---|---|---|---|---|---|---|
| 1 | 2 | 3 | ||||
| 4 | 5 | 6 | 7 | 8 | 9 | 10 |
| 11 | 12 | 13 | 14 | 15 | 16 | 17 |
| 18 | 19 | 20 | 21 | 22 | 23 | 24 |
| 25 | 26 | 27 | 28 | 29 | 30 | 31 |
- dma development
- mmlp
- ultra low latency
- hft개발
- fontesfintech
- speed trading
- 주문fep
- trading engineering
- 저지연시스템
- DMA개발
- low latency
- hft programming
- Korea HFT
- system trading
- 프랍데스크
- high frequency trading
- korea inbound
- 자동매매
- 트레이딩 엔지니어링
- nic offload
- Korea dma
- dma fep
- fep개발
- 주문 오더북
- kernel bypass
- dma hft
- algo trading
- HFT system
- 시스템 트레이딩
- hft tuning
- Today
- Total
Fontes Fintech
Inside a Low-Latency Trading Network: UDP Market Data and TCP Order Flow | Trading Engineering — Deep Dive #9 본문
Inside a Low-Latency Trading Network: UDP Market Data and TCP Order Flow | Trading Engineering — Deep Dive #9
폰테스 핀테크 :: 금융거래의 안전한 미래 2026. 10. 5. 23:46Inside a Low-Latency Trading Network: UDP Market Data and TCP Order Flow
Trading Engineering — Deep Dive #9
Introduction
When discussing networking in low-latency trading systems, simply comparing TCP and UDP is not enough.
In a real trading system, market data and order flow follow different network paths and have different engineering requirements.
A simplified exchange-connected trading architecture can be represented as:
                     Exchange
                    /        \
                   /          \
          Market Data          Order
             UDP                TCP
              ↓                  ↑
             NIC                NIC
              ↓                  ↑
      Market Data Handler    Order FEP
              ↓                  ↑
          Order Book        Order Manager
              ↓                  ↑
           Strategy ─────→ Risk Check
Market data typically enters the system through a UDP multicast-based high-speed data path, while orders are transmitted through a TCP-based order session.
Therefore, the key engineering question is not which protocol to choose.
The real question is how efficiently and reliably we can process each protocol within its intended path.
This Deep Dive examines these paths from the packet-processing perspective, from the NIC and CPU to the application and FEP.
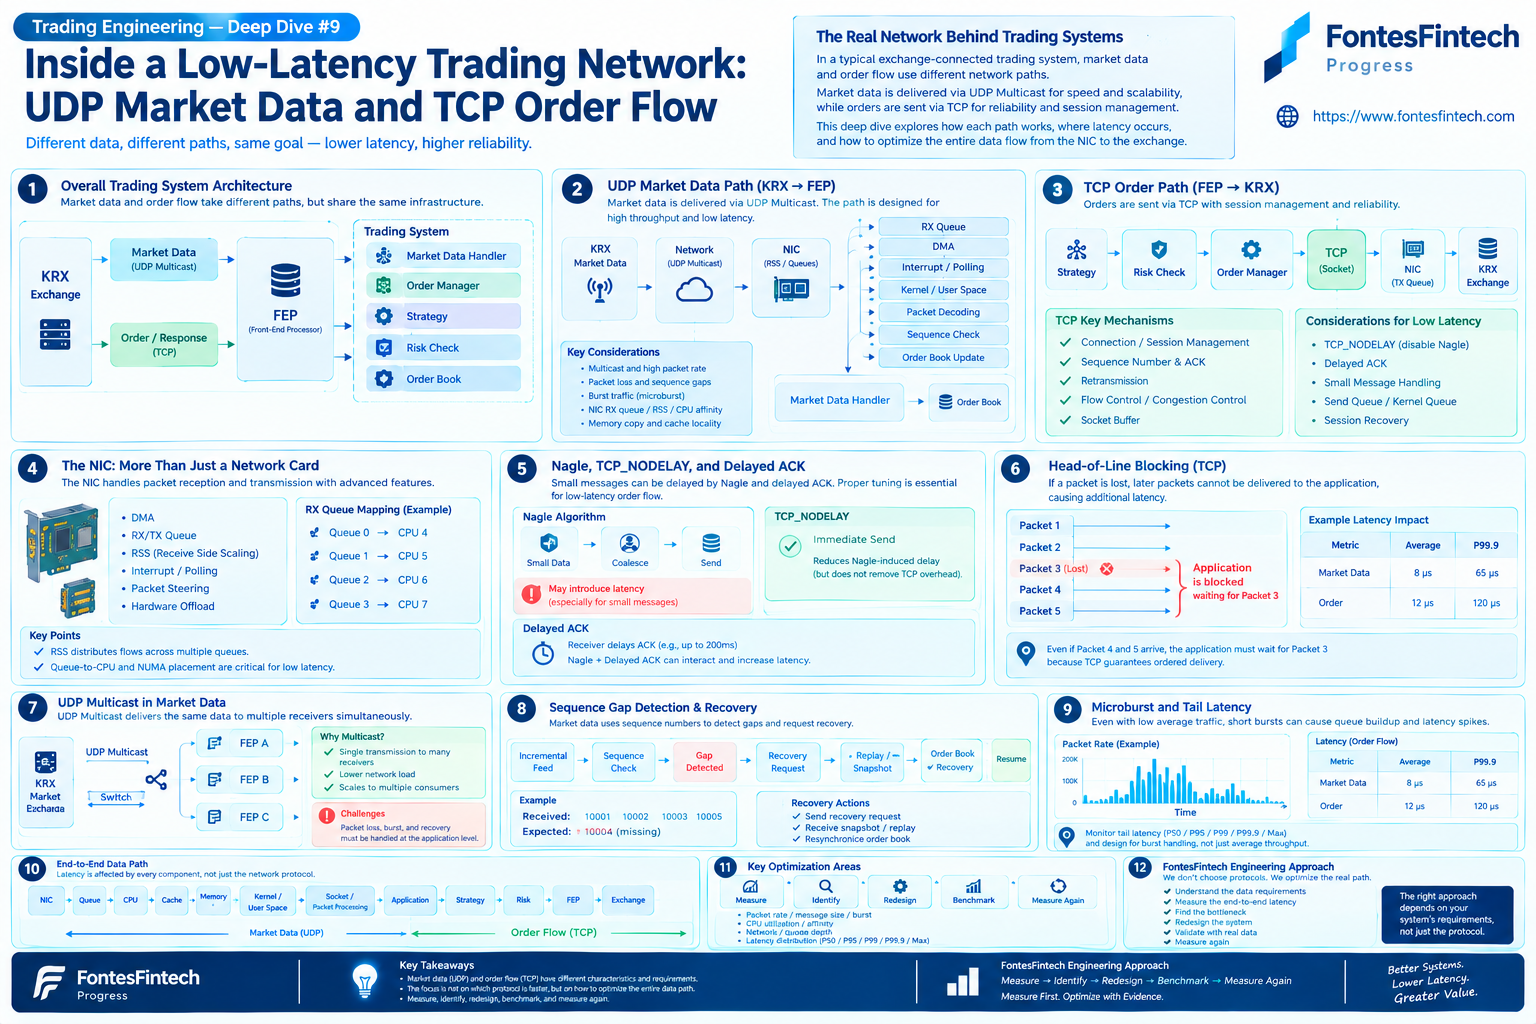
1. One Trading System, Two Network Paths
Market data and order flow have fundamentally different characteristics.
Market Data
Exchange
   ↓
UDP Multicast
   ↓
NIC
   ↓
Market Data Handler
   ↓
Order Book
   ↓
Strategy
Order Flow
Strategy
   ↓
Risk Check
   ↓
Order Manager
   ↓
TCP
   ↓
NIC
   ↓
Exchange
For market data, important considerations include:
- High packet rates
- Burst traffic
- Packet-loss detection
- Sequence tracking
- Multicast
- Fast decoding
- Fast Order Book updates
For order flow, important considerations include:
- Session state
- Message ordering
- Transmission latency
- Connection management
- Error handling
- Response processing
- Recovery
The same FEP therefore needs to handle different network behaviors within a single trading architecture.
2. The Actual Path of UDP Market Data
Consider a market-data packet arriving from an exchange.
A simplified path looks like this:
Exchange
   ↓
Network
   ↓
NIC
   ↓
RX Queue
   ↓
DMA
   ↓
Interrupt / Polling
   ↓
Kernel / User Space
   ↓
Market Data Handler
   ↓
Decoder
   ↓
Sequence Check
   ↓
Order Book
The important point is that UDP itself does not determine the entire latency of the system.
In practice, latency can be affected by every stage:
NIC → Queue → CPU → Memory → Packet Processing → Application
3. The NIC Is More Than a Network Card
As discussed in Deep Dive #7, a NIC is an important component of the data path.
A modern high-performance NIC may provide:
- DMA
- RX/TX Queues
- RSS
- Interrupt processing
- Packet steering
- Hardware offload
When a market-data packet arrives, the NIC can use DMA to transfer packet data into memory.
Conceptually:
Network Packet
      ↓
     NIC
      ↓
   RX Queue
      ↓
     DMA
      ↓
   Memory
The CPU then processes the corresponding data structures.
This means that NIC configuration can directly influence the behavior of the application-level trading system.
4. RX Queues and CPU Affinity
High-performance NICs can use multiple RX queues.
For example:
NIC
 ├── RX Queue 0 ──→ CPU 4
 ├── RX Queue 1 ──→ CPU 5
 ├── RX Queue 2 ──→ CPU 6
 └── RX Queue 3 ──→ CPU 7
The important question is not simply how many queues exist.
The key question is:
Which queue is processed by which CPU?
For low-latency systems, the following relationships should be considered together:
NIC Queue
    ↓
IRQ / Polling
    ↓
CPU Core
    ↓
NUMA Node
    ↓
Memory
    ↓
Application Thread
Poor placement at any stage can introduce additional latency.
5. RSS Is Not Automatically Better
RSS, or Receive Side Scaling, distributes network flows across multiple RX queues.
A simplified model looks like:
                 NIC
                  │
             RSS Hash
          ┌───────┼───────┐
          ↓       ↓       ↓
       Queue 0 Queue 1 Queue 2
          ↓       ↓       ↓
       CPU 4    CPU 5    CPU 6
This can be extremely useful on general-purpose servers.
However, in a low-latency trading system, distribution itself is not necessarily the goal.
Suppose the main Market Data Handler is pinned to CPU 4, but the corresponding network traffic is distributed across several CPUs.
The additional movement between queues, CPUs, caches, or memory domains may work against the desired data locality.
Therefore, RSS should be considered together with:
RSS → RX Queue → IRQ Affinity → CPU Affinity → NUMA
6. Interrupts and Polling
Once a packet arrives, the CPU needs a mechanism to process it.
Two common approaches are interrupt-driven processing and polling.
Interrupt-driven Processing
Packet
  ↓
NIC
  ↓
Interrupt
  ↓
CPU
  ↓
Packet Processing
The NIC notifies the CPU when work is available.
Polling
CPU
 ↓
Check Queue
 ↓
Packet?
 ├─ No → Check Again
 └─ Yes → Process
Polling continuously consumes CPU resources.
However, this is not necessarily a disadvantage in a low-latency environment.
If a dedicated CPU core is available, continuously polling that core may reduce waiting and scheduling variability.
The objective is therefore not always:
Minimize CPU utilization
but rather:
Minimize latency while maintaining predictable behavior.
7. Microbursts
Average packet rate alone can be misleading when designing a market-data system.
A feed may have a relatively moderate average packet rate while producing very large bursts over a short period.
For example:
Packet Rate

             ████████████
             ████████████
             ████████████
_______________________________
                 Time
These short bursts are commonly referred to as microbursts.
The important metric is therefore not just average throughput, but the system's ability to absorb short-duration bursts.
Relevant components include:
- NIC RX Ring
- RX Queue
- Kernel Queue
- Socket Buffer
- Application Queue
- CPU Processing Rate
Therefore:
Average Throughput ≠ Burst Handling Capability
8. Sequence Numbers and Gap Detection
For UDP-based market data, successfully receiving a packet does not necessarily mean that the application has received a complete and consistent data stream.
Market-data messages may contain sequence numbers.
For example:
10001
10002
10003
10004
10005
This is a continuous sequence.
But consider:
10001
10002
10003
10005
The application can immediately detect that something is missing.
Expected : 10004
Received : 10005

       ↓

   GAP DETECTED
This is sequence-gap detection.
For high-speed market data, sequence tracking is therefore a fundamental part of the receiver rather than an optional feature.
9. Gap Recovery
Detecting a gap is only the beginning.
The system needs a recovery mechanism.
Conceptually:
Incremental Feed
       ↓
Sequence Check
       ↓
Gap Detected
       ↓
Recovery Request
       ↓
Replay / Snapshot
       ↓
Order Book Recovery
       ↓
Resume Incremental Feed
The challenge is not simply making recovery fast.
The system must also determine:
How should the trading system maintain a consistent market state while recovery is taking place?
This makes a market-data handler more than a simple UDP receiver.
It is effectively a state reconstruction system.
10. The Order Book Is the Next Stage of the Data Path
Receiving packets quickly is not enough.
The Market Data Handler must decode the message and update the Order Book.
UDP Packet
    ↓
Decode
    ↓
Sequence Check
    ↓
Message Classification
    ↓
Order Book Update
    ↓
Strategy
Latency can be introduced by many operations:
- Memory copies
- Parsing
- Branching
- Cache misses
- Locks
- Shared data
- False sharing
This is why network optimization cannot be completely separated from CPU and memory optimization.
11. The TCP Order Path
Now consider the opposite direction.
When a trading strategy generates an order, a simplified path is:
Strategy
   ↓
Risk Check
   ↓
Order Manager
   ↓
TCP
   ↓
Socket
   ↓
Kernel Network Stack
   ↓
NIC TX Queue
   ↓
Network
   ↓
Exchange
Unlike market-data reception, order processing is primarily concerned with transmission latency and reliable session behavior.
The time between the strategy generating an order and the NIC actually transmitting the corresponding data can be important.
12. The TCP Send Path
Consider a simple application call:
send(sock, buffer, length, 0);Calling send() does not necessarily mean that the packet has immediately left the NIC.
Conceptually, the path may look like:
Application
     ↓
send()
     ↓
Socket Buffer
     ↓
TCP Processing
     ↓
IP
     ↓
NIC Driver
     ↓
TX Queue
     ↓
NIC
     ↓
Network
There are multiple stages between the application and the wire.
Therefore, measuring order latency requires more than simply measuring the duration of a send() call.
13. TCP_NODELAY and Small Order Messages
Order messages are often relatively small.
In such cases, TCP packetization behavior can influence latency.
The Nagle algorithm may coalesce small TCP writes in order to reduce the number of packets.
For latency-sensitive order paths, TCP_NODELAY may therefore be considered.
int flag = 1;

setsockopt(
    sock,
    IPPROTO_TCP,
    TCP_NODELAY,
    &flag,
    sizeof(flag)
);
However:
Enabling TCP_NODELAY does not automatically optimize the entire order path.
Sending more small packets can increase:
- Packet rate
- CPU overhead
- NIC processing
- Network-stack workload
Therefore, the correct configuration depends on the actual system and workload.
The principle remains:
Measure first, then optimize.
14. TCP Session and Connection State
In an order FEP, the TCP connection itself is part of the system state.
A simplified view is:
TCP Session
 ├── Connection
 ├── Send State
 ├── Receive State
 ├── Sequence
 ├── ACK
 └── Recovery
When a connection fails, simply creating a new socket may not be sufficient.
An FEP may need to manage:
- Connection status
- Session status
- Outstanding messages
- Reconnection
- Recovery
- Duplicate prevention
- Order state
TCP therefore becomes more than a transport mechanism.
It becomes closely connected to the state management of the order session.
15. Common Problems Across UDP and TCP
Although the protocols are different, both paths can suffer from similar system-level problems.
NIC
 ↓
Queue
 ↓
CPU
 ↓
Cache
 ↓
Memory
 ↓
Application
For example:
Cache Miss
The required data may not be available in the CPU cache.
NUMA Remote Access
A thread may access memory located on another NUMA node.
Memory Copy
Unnecessary data movement may increase processing time.
Lock Contention
Multiple threads may compete for the same shared data.
Thread Migration
A processing thread may move between CPU cores.
Therefore:
The complete Network-to-Application path can matter more than the protocol itself.
16. The Critical Data Path in an FEP
If we look at an FEP as a complete data path:
             MARKET DATA
                  │
                  ▼
           UDP Multicast
                  │
                  ▼
                 NIC
                  │
             RX Queue
                  │
                  ▼
          Market Data Handler
                  │
                  ▼
              Order Book
                  │
                  ▼
               Strategy
                  │
                  ▼
              Risk Check
                  │
                  ▼
            Order Manager
                  │
                  ▼
                 TCP
                  │
                  ▼
                 NIC
                  │
                  ▼
               EXCHANGE
There are two major latency-sensitive directions:
Market Data → Strategy
and
Strategy → Exchange
The first asks:
How quickly can market information reach the strategy?
The second asks:
How quickly can an order reach the exchange after the strategy makes a decision?
17. End-to-End Latency
For this reason, it is not sufficient to simply say:
UDP latency = X μs
TCP latency = Y μs
Instead, we need to measure the individual stages.
Market Data
Exchange Timestamp
       ↓
NIC Receive
       ↓
Market Data Handler
       ↓
Decode
       ↓
Order Book
       ↓
Strategy
Order
Strategy Decision
       ↓
Risk Check
       ↓
Order Manager
       ↓
Socket Send
       ↓
NIC TX
       ↓
Exchange
Timestamps at different stages allow engineers to identify where latency is actually being spent.
18. Tail Latency
Average latency alone can also be misleading.
For example:
MetricExample
| P50 | 8 μs |
| P95 | 11 μs |
| P99 | 18 μs |
| P99.9 | 65 μs |
| Max | 420 μs |
Even when the typical latency is very low, occasional latency spikes may occur.
For low-latency trading systems, it is therefore useful to examine:
P50 → P95 → P99 → P99.9 → Max
Tail latency can increase under conditions such as:
- Microbursts
- CPU scheduling
- NUMA remote access
- Cache misses
- Queueing
- Memory contention
19. Kernel Networking and Kernel Bypass
As discussed in Deep Dive #8, Kernel Bypass is another possible optimization point.
A conventional path can be represented as:
NIC
 ↓
Driver
 ↓
Kernel
 ↓
Network Stack
 ↓
Socket
 ↓
Application
With user-space networking, the latency-sensitive data path can be made more direct:
NIC
 ↓
Queue
 ↓
User-Space Packet Processing
 ↓
Application
However, an important principle remains:
Kernel Bypass should not become the goal by itself.
The first question should always be:
Where is the latency actually being spent?
Only then should the appropriate optimization be selected.
20. Putting the Entire FEP Together
The concepts covered throughout this Deep Dive series are not isolated technologies.
They form a single end-to-end trading path:
CPU Cache
    ↓
False Sharing
    ↓
CPU Affinity
    ↓
NUMA
    ↓
Polling
    ↓
Interrupt / NAPI
    ↓
NIC / RSS / Queue
    ↓
Kernel Networking
    ↓
Kernel Bypass
    ↓
UDP Market Data
    ↓
Order Book
    ↓
Strategy
    ↓
Risk Check
    ↓
TCP Order Flow
    ↓
FEP
    ↓
Exchange
Each technology operates at a different layer, but they all influence the same objective:
predictable end-to-end latency.
21. The FontesFintech Engineering Approach
In low-latency financial systems, using a particular technology is not the objective.
Understanding the complete data path is.
We start with a simple question:
Where is the latency actually being spent?
Then we follow an engineering cycle:
Measure
Measure where time is being consumed.
↓
Identify
Identify the actual source of latency.
↓
Redesign
Change the architecture or implementation where necessary.
↓
Benchmark
Compare the before-and-after behavior under equivalent conditions.
↓
Measure Again
Verify whether the latency distribution actually improved.
This means CPU, memory, NIC, kernel, network protocol, and application architecture should not be treated as completely separate areas.
They are parts of one end-to-end trading system.
Conclusion
In a real trading system, UDP and TCP are not simply competing alternatives.
They serve different purposes for different data flows.
Market Data
UDP Multicast → NIC → RX Queue → Market Data Handler → Order Book → Strategy
Order Flow
Strategy → Risk Check → Order Manager → TCP → NIC → Exchange
The core engineering problem is therefore not choosing between TCP and UDP.
It is:
How can we process each protocol through the shortest and most predictable data path?
To answer that question, we need to look at the entire path:
NIC → Queue → CPU → Cache → Memory → Kernel/User Space → Application → FEP → Exchange
And ultimately, we return to measurement.
Measure the Path. Understand the Bottleneck. Optimize with Evidence.
Next — Trading Engineering · Deep Dive #10
Memory Ordering, Atomic Operations and Memory Barriers
In the next article, we will connect CPU Cache → False Sharing → CPU Affinity → NUMA → Polling → NIC → Kernel Bypass → Trading Network to the CPU memory model and explore Atomic Operations, Acquire/Release Semantics, Memory Barriers, and Lock-Free Ring Buffers in C-based low-latency systems.


